

u-Efficiency
Production Efficiency Assessment
u-Efficiency is a solution designed to improve factory productivity and shorten production cycle time.
Traditional production management often relies on statistical reports or experience, which may overlook hidden factors and lead to ineffective improvements.
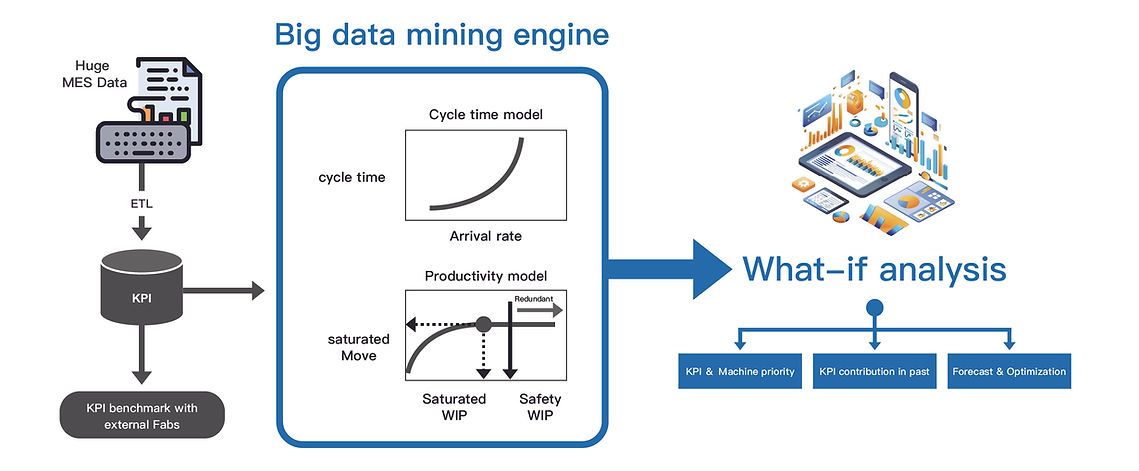
By leveraging big data and data mining techniques, u-Efficiency builds dynamic factory models with over 90% prediction accuracy, enabling scientific analysis of more than 30 KPIs to identify the true drivers impacting Move, WIP, and Cycle Time.
The system evaluates different hypothetical scenarios to identify key improvement opportunities, helping managers focus on the most influential factors and equipment using the 20–80 rule. It also calculates the optimal WIP levels for each workstation to prevent over-release and avoid unnecessary resource waste.
─ Key Advantages ─

Automated Big Data Analysis
Uses daily MES historical production data for data mining and modeling.
The system automatically learns and updates models, providing managers with timely and clear improvement insights.

Cross-Fab Benchmarking Capability
With data accumulated from more than 20 fabs, u-Efficiency enables comparison with a factory’s own historical best performance as well as benchmarking against international fabs, helping identify key improvement priorities and strengthen team commitment.

High-Accuracy Predictive Models
Builds Cycle Time and Productivity models with accuracy exceeding 90%, providing a quantified relationship between various KPIs and factory Move & Cycle Time.
Forward-Looking Decision Support
Provides what-if simulations and optimal target recommendations to support management in PDCA cycles.
Improvement benefits can be quantified, enabling precise adjustments and strategy refinement.

Benefits
-
Cycle Time +30%↑, Productivity +2%↑
-
Quickly identify key improvement areas and uncover breakthrough opportunities
-
Shorten cycle time, reduce bottlenecks, and increase capacity utilization
-
Benchmark against international fabs to understand competitive strengths
Unable to Identify
Hidden Bottlenecks
Uncertain How to Address Long Cycle Times
Low Capacity Utilization
Traditional analyses often focus only on bottleneck stations and overlook hidden factors at non-bottleneck areas, resulting in ineffective improvements.
Cycle time drivers are complex. Issues such as poor scheduling, tool instability, uneven WIP distribution, or low utilization can all lead to long cycle times—yet it is difficult to determine where to start.
Although equipment quantity seems sufficient, variation in loading and imbalance across tools reduce actual productivity, making it unclear what the true bottlenecks are.
WIP Accumulation & Imbalance
Conflicts Between Maintenance and Production Needs
Lack of Predictive
Decision Support
Excess or poorly distributed WIP increases dispatching complexity, leading to bottlenecks being starved and non-bottlenecks overloaded—hurting productivity and cycle time.
Poor PM scheduling and engineering activities that do not align with low-load periods result in load imbalance and capacity loss.
Relying only on after-the-fact reports prevents early detection of cycle time or productivity issues, missing the chance for proactive improvements.
─ Solutions ─
1
KPI Analysis & Prioritization
Automatically analyzes over 30 KPIs, quantifies their impact on Move, WIP, and Cycle Time, and ranks improvement priorities based on impact level—helping factories focus on critical improvements.
2
Cycle Time & Productivity Modeling
Uses big data modeling to accurately capture changes in Cycle Time and Productivity, helping forecast and analyze future efficiency trends to enhance overall performance.
3
Optimal WIP Level Calculation
Calculates the optimal WIP level at each station to prevent bottleneck starvation or non-bottleneck overload. Maintains line balance and stability based on historical data and dynamic models.
4
Predictive Maintenance & Scheduling Recommendations
Predicts future maintenance or PM timing by integrating product mix changes and equipment loading, providing forward-looking decisions to reduce capacity loss.
5
Cross-Fab Benchmarking & Gap Analysis
Supports cross-fab KPI comparison and gap analysis to quickly identify key improvement points across different sites and benchmark against international leaders.
6
Scenario Simulation & Resource Allocation
Uses what-if analysis to simulate different improvement scenarios, recommending the best improvement combinations and resource strategies to support precise decision-making.